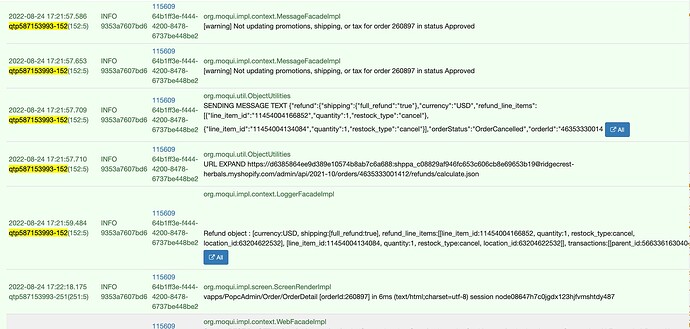
You mentioned Sebastian who I’m not sure I’ve met, is Sebastian the developer working with you on this and is he available to join in the discussion here? This is likely a very technical issue.
Calling the queue#SystemMessage service might be an important clue, along with the idea that this might be a transaction conflict issue, because that service updates the SystemMessage record in a separate transaction so that it succeeds or fails independently of whatever calls it.
The problem with that is that record locking in separate transactions is very picky. There are a few patterns where things can go wrong, but a common one looks like this:
- transaction A locks record X (by update, for-update find/query, OR a common gotcha in some databases where record X gets locked because it is a foreign key of record Y… for example if you update SystemMessage to set the orderId which is a foreign key for OrderHeader then it locks, or tries to lock, the OrderHeader record too!)
- in the same thread transaction A (from whatever calls queue#SystemMessage) is paused and transaction B (in queue#SystemMessage itself) is run synchronously, so transaction A is waiting for transaction B to complete before it can continue
- transaction B tries to lock record X
- TX A has a lock on record X so TX B is waiting for that lock… AND TX A is waiting for TX B to complete, so there is a deadlock between the record lock on one side and TX A waiting for TX B on the other
- this is not the sort of deadlock that a database can detect (where both sides are locks in the database), so eventually the lock wait will timeout which results on errors being logged
When you say the service never returns and there are no error messages, is the actual behavior that around 1 minute later there are log messages in the thread that was running the service, and those log messages show errors, perhaps even a lock wait timeout error?
That would be the first thing I look for, and the easiest way to do is filter the log by the thread name that was running the service so you can see just the logs from that thread over a longer period of time.
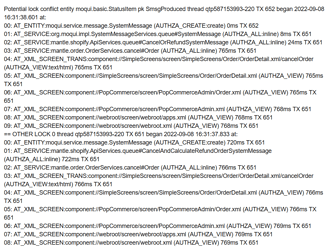
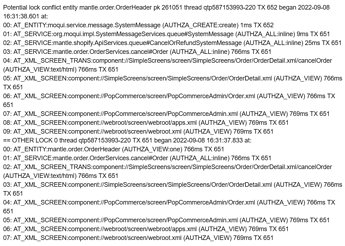
Because transaction management can get messy there are some tools in Moqui Framework to help track down such issues, especially the Entity Facade lock tracking feature. To enable this set the env var entity_lock_track to true (in an OS env var, or in a moqui conf XML file). There is some runtime overhead (memory and processing time) for this, so it is not enabled by default.
What the entity lock tracking does is track all transactions and records locked on the Moqui server and then it logs warning BEFORE an operation might lock a record if another transaction already has a lock on that record.
The downside to this is it has LOTS of false positives, ie warnings about potential lock conflicts that are not any sort of issue, just part of normal expected operation. In a case like this it might tell you exactly what you’re looking for in a log message after the “Queueing Cancel System Message…” log message you mentioned.
One little detail, the entity lock tracking feature is on by default in dev mode (using the MoquiDevConf.xml file which is the default for devs, ie when just running java -jar moqui.war). If this can be reproduced locally, then doing so on a local dev machine is the easier way to go. If it only happens in production and only periodically, you’ll have to turn on the entity lock tracking on the production server and wait for it to happen. This is not generally harmful, mainly just increases the memory used and slightly slows things down, so unless the production server is already having trouble keeping with its load then it’s not a problem. FWIW I’ve done this many times on production servers, tricky transaction problems are often intermittent. 


